A lot of people showed a huge interest in analyzing Facebook data with R. So I decided to write some more tutorials about the possibilities you have with Rfacebook package created by Pablo Barbera.
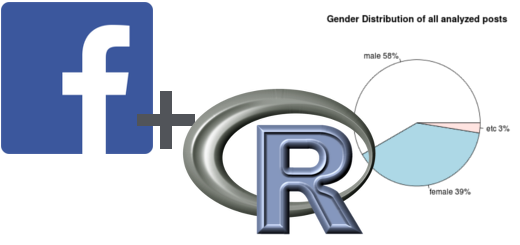
This tutorial will be about plotting the gender distribution of the likes of Facebook page posts. The Rfacebook package does not include a direct function for this problem, but with the combination of a few different functions it is possible.
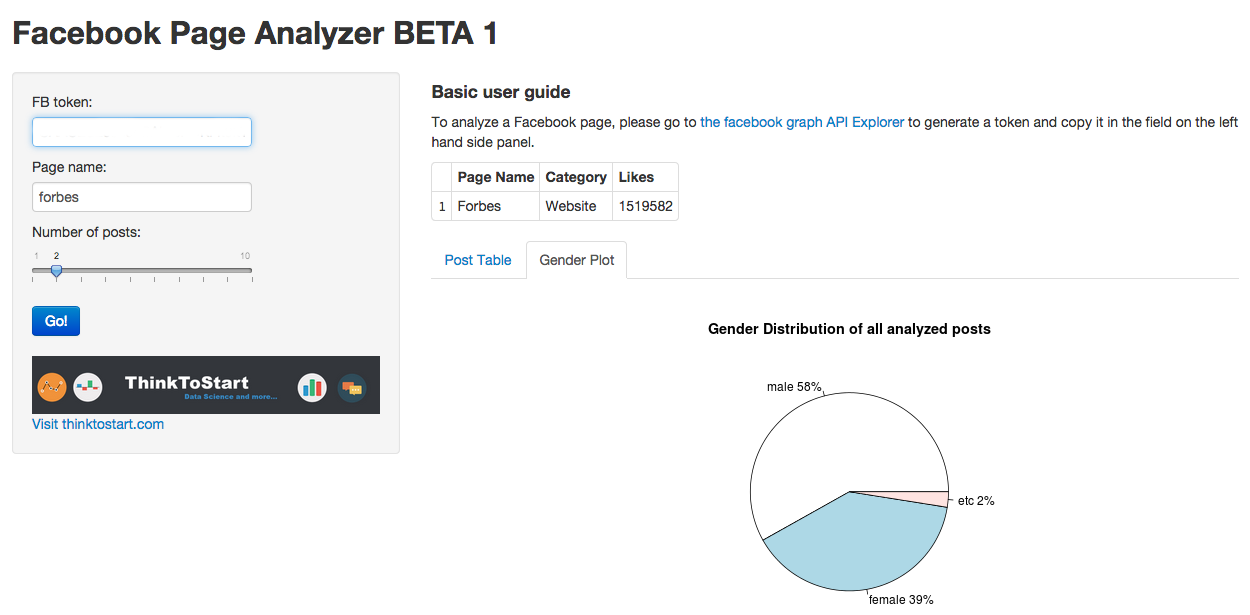
If you just want to try the function take a look at the first BETA of my Facebook Page Analyzer tool which includes the method described in this tutorial: https://thinktostart.shinyapps.io/FB_page_analyzer/
Authentication:
Like every time we need to go through the authentication process. You can find the steps to do so in the first part of this tutorial:
Gender Analysis of Facebook Post Likes
First we have to load the Rfacebook package
|
1 2 |
install.packages(„Rfacebook“) require(Rfacebook) |
When you follow the steps in the tutorial I mentioned above you got your authentication token.
|
1 |
token <- „XXX" |
Then we have to define the number of posts of the page we want to analyze. These are always the most recent ones. But they can have a lot of likes and as we have to process different actions on every single like it can last a lot of time if you choose the number of posts too big.
|
1 |
number_posts <- 2 |
The last variable we have to define is, of course, the name of the page we want to analyze.
|
1 |
page_name <- „forbes" |
In the next step we download the comments from the page with:
|
1 |
page <- getPage(page_name, token, n = number_posts, feed = FALSE) |
This returns a data frame with the number of posts we requested if it is available. The posts have following attributes:
from_id, from_name, message, created_time, type, link, id, likes_count, comments_count, shares_count
For our analysis we just need the column id which contains a unique identifier for every post, also called the post id.
|
1 |
posts <- page$id |
Get Post Like details
In the next steps there are happening basically two processes. First we create a new entry in our final data frame from the post we are analyzing at the moment. And then we use its id to get more insights to this post with the getPost() function.
The returned data frame basically contains 3 values: post, likes, comments.
These categories contain several lists with even more data, but we just need the data stored in the „likes“ section. There we can find the fields from_name and from_id for every single like of the post.
So we extract the user_id which is the field from_id and get the user insights with the getUsers() function. From the returning user data we extract the gender and save it to a temporary gender_frame.
After we processed all likes of the post and stored the gender of every single like in the gender_frame we divide it in 3 categories: male, female and etc. So we count how many people said they are „male“, „female“ or something different.
We then save the results in our data_frame_gender and process the next posts in the same way.
|
1 2 3 4 5 6 7 8 9 10 11 12 13 14 15 16 17 18 19 20 21 22 23 24 25 26 27 28 29 30 31 32 33 34 35 36 37 38 39 |
data_frame_gender <- data.frame(post=character(),male=numeric(),female=numeric(),etc=numeric(),likes=numeric(),type=character(),stringsAsFactors=FALSE) for(i in 1:length(posts)) { temp <- posts[i] #dataframe values: #post id #likes count # post <- getPost(temp,token) data_frame_gender[i,1] <- post$post$message data_frame_gender[i,5] <- post$post$likes data_frame_gender[i,6] <- post$post$type gender_frame <- data.frame(gender=character(),stringsAsFactors=FALSE) for(j in 1:length(post$likes$from_id)) { likes <- post$likes$from_id user_id <- likes[j] user <- getUsers(user_id,token=token) gender <- user$gender gender_frame[nrow(gender_frame)+1,] <- gender } number_males <- nrow(subset(gender_frame, gender=="male")) number_females <- nrow(subset(gender_frame, gender=="female")) number_etc <- data_frame_gender[i,5] - (number_males+number_females) data_frame_gender[i,2] <- number_males data_frame_gender[i,3] <- number_females data_frame_gender[i,4] <- number_etc } |
Plot the data
The plotting can be done really fast.
We define the slices of our pie chart and add the names to them.
|
1 2 3 4 5 6 7 8 |
slices <- c(sum(data_frame_gender$male),sum(data_frame_gender$female),sum(data_frame_gender$etc)) pct <- round(slices/sum(slices)*100) lbls <- names(data_frame_gender[2:4]) lbls <- paste(lbls, pct) # add percents to labels lbls <- paste(lbls,"%",sep="") # ad % to labels pie(slices, labels = lbls, main="Gender Distribution of all analyzed posts") |
https://github.com/JulianHill/R-Tutorials/blob/master/r_facebook_gender.r